
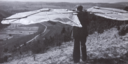
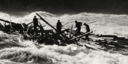
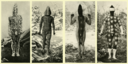

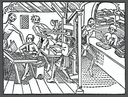
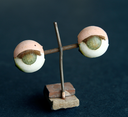
We start with some images made from select pages of Guttormgaard's ARKIV book in PDF form. Many of the pages are in fact spreads of multiple images, sometimes cropped.
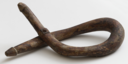
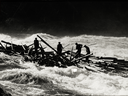
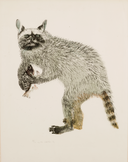
Add to this a selection of "original" digital images from the archive, including images that have been placed in pages of ARKIV (and some that aren't).
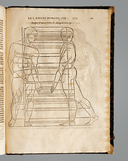
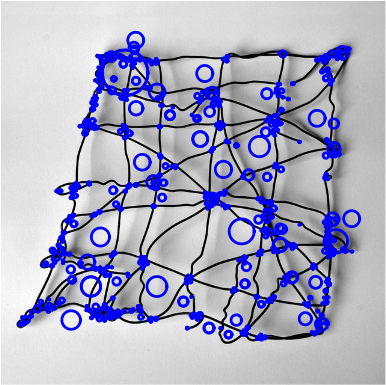
First, the SIFT algorithm is performed on each image, features are shown here as blue circles. The actual features are in fact detailed descriptions of 128 vectors based on promient gradients occuring in square patches around the feature center.
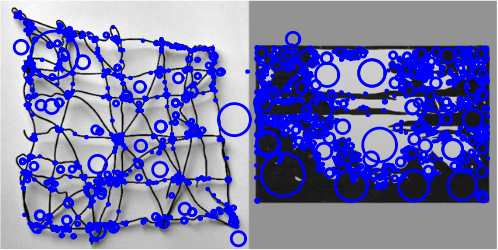
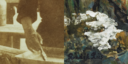
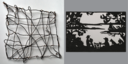
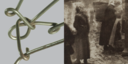
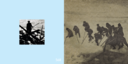
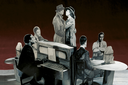
Now we run a feature comparison / matching algorithm between an original image and a book page containing the image:
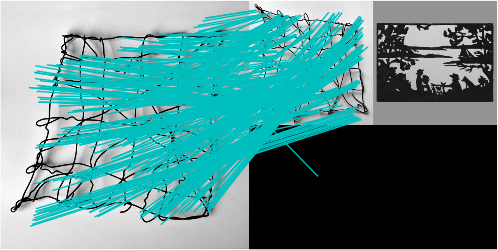
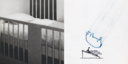
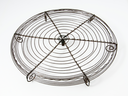
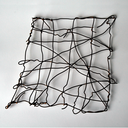
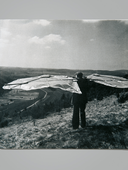
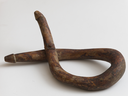
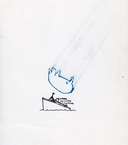
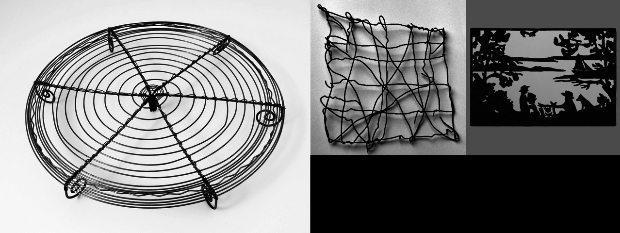
Here, the algorithm correctly detects a large number of matching features, detecting not only the presence of the placed image but its position and orientation on the book page. The same matching algorithm results in no matches when comparing the same page to a similarly photographed wire object:
The last, and most time consuming step, is to create a matrix of matching images, comparing each image with every other image and counting the number of matching features. Finally, a graph is drawn showing images with matching features. Note that this matching technique is very inefficient as it grows exponentially with the number of input images (ie the number of source + number of pages). It will be necessary to employ some additional methods to improve the algorithm when considering the entire book.
| - | ||||||||||||||||||||||||
|---|---|---|---|---|---|---|---|---|---|---|---|---|---|---|---|---|---|---|---|---|---|---|---|---|
| - | 0 | 0 | 1 | 0 | 0 | 0 | 0 | 0 | 0 | 0 | 0 | 0 | 0 | 0 | 0 | 0 | 0 | 0 | 0 | 0 | 0 | 0 | 0 | |
| 0 | - | 0 | 1 | 0 | 1 | 0 | 1 | 0 | 0 | 0 | 0 | 0 | 0 | 1 | 748 | 1 | 0 | 0 | 2 | 0 | 0 | 0 | 0 | |
| 0 | 0 | - | 0 | 0 | 0 | 2 | 0 | 0 | 0 | 0 | 0 | 0 | 0 | 0 | 1 | 0 | 0 | 0 | 0 | 0 | 1 | 0 | 0 | |
| 1 | 1 | 0 | - | 0 | 0 | 1 | 0 | 0 | 111 | 119 | 0 | 0 | 0 | 1 | 1 | 0 | 0 | 0 | 1364 | 0 | 0 | 0 | 0 | |
| 0 | 0 | 0 | 0 | - | 0 | 1 | 0 | 1 | 0 | 0 | 0 | 0 | 0 | 0 | 0 | 1 | 0 | 0 | 1 | 0 | 0 | 0 | 76 | |
| 0 | 1 | 0 | 0 | 0 | - | 0 | 0 | 0 | 1 | 0 | 1 | 0 | 1 | 1 | 0 | 0 | 2 | 0 | 1 | 0 | 12 | 0 | 0 | |
| 0 | 0 | 2 | 1 | 1 | 0 | - | 0 | 1 | 1 | 0 | 0 | 349 | 0 | 1 | 1 | 0 | 0 | 1 | 0 | 0 | 2 | 0 | 0 | |
| 0 | 1 | 0 | 0 | 0 | 0 | 0 | - | 0 | 0 | 0 | 1 | 0 | 0 | 0 | 1 | 0 | 0 | 0 | 0 | 0 | 1 | 0 | 0 | |
| 0 | 0 | 0 | 0 | 1 | 0 | 1 | 0 | - | 0 | 0 | 0 | 0 | 0 | 0 | 0 | 1086 | 0 | 0 | 0 | 0 | 1 | 0 | 0 | |
| 0 | 0 | 0 | 111 | 0 | 1 | 1 | 0 | 0 | - | 15 | 0 | 0 | 0 | 1 | 0 | 0 | 0 | 0 | 120 | 0 | 0 | 0 | 0 | |
| 0 | 0 | 0 | 119 | 0 | 0 | 0 | 0 | 0 | 15 | - | 0 | 0 | 0 | 0 | 0 | 0 | 0 | 0 | 104 | 0 | 0 | 0 | 0 | |
| 0 | 0 | 0 | 0 | 0 | 1 | 0 | 1 | 0 | 0 | 0 | - | 0 | 0 | 0 | 0 | 0 | 1 | 1 | 0 | 0 | 0 | 0 | 0 | |
| 0 | 0 | 0 | 0 | 0 | 0 | 349 | 0 | 0 | 0 | 0 | 0 | - | 0 | 0 | 0 | 0 | 0 | 2 | 0 | 0 | 0 | 0 | 0 | |
| 0 | 0 | 0 | 0 | 0 | 1 | 0 | 0 | 0 | 0 | 0 | 0 | 0 | - | 0 | 0 | 0 | 0 | 0 | 0 | 0 | 1 | 0 | 0 | |
| 0 | 1 | 0 | 1 | 0 | 1 | 1 | 0 | 0 | 1 | 0 | 0 | 0 | 0 | - | 0 | 0 | 0 | 0 | 0 | 0 | 0 | 0 | 0 | |
| 0 | 748 | 1 | 1 | 0 | 0 | 1 | 1 | 0 | 0 | 0 | 0 | 0 | 0 | 0 | - | 1 | 0 | 0 | 0 | 0 | 0 | 0 | 0 | |
| 0 | 1 | 0 | 0 | 1 | 0 | 0 | 0 | 1086 | 0 | 0 | 0 | 0 | 0 | 0 | 1 | - | 0 | 0 | 0 | 0 | 1 | 0 | 0 | |
| 0 | 0 | 0 | 0 | 0 | 2 | 0 | 0 | 0 | 0 | 0 | 1 | 0 | 0 | 0 | 0 | 0 | - | 0 | 0 | 0 | 0 | 0 | 0 | |
| 0 | 0 | 0 | 0 | 0 | 0 | 1 | 0 | 0 | 0 | 0 | 1 | 2 | 0 | 0 | 0 | 0 | 0 | - | 0 | 0 | 0 | 0 | 0 | |
| 0 | 2 | 0 | 1364 | 1 | 1 | 0 | 0 | 0 | 120 | 104 | 0 | 0 | 0 | 0 | 0 | 0 | 0 | 0 | - | 0 | 0 | 0 | 0 | |
| 0 | 0 | 0 | 0 | 0 | 0 | 0 | 0 | 0 | 0 | 0 | 0 | 0 | 0 | 0 | 0 | 0 | 0 | 0 | 0 | - | 0 | 0 | 0 | |
| 0 | 0 | 1 | 0 | 0 | 12 | 2 | 1 | 1 | 0 | 0 | 0 | 0 | 1 | 0 | 0 | 1 | 0 | 0 | 0 | 0 | - | 0 | 0 | |
| 0 | 0 | 0 | 0 | 0 | 0 | 0 | 0 | 0 | 0 | 0 | 0 | 0 | 0 | 0 | 0 | 0 | 0 | 0 | 0 | 0 | 0 | - | 0 | |
| 0 | 0 | 0 | 0 | 76 | 0 | 0 | 0 | 0 | 0 | 0 | 0 | 0 | 0 | 0 | 0 | 0 | 0 | 0 | 0 | 0 | 0 | 0 | - |
We use the utility graphviz to draw a map of connected images, where two images are connected when there's more than 1 matching feature:
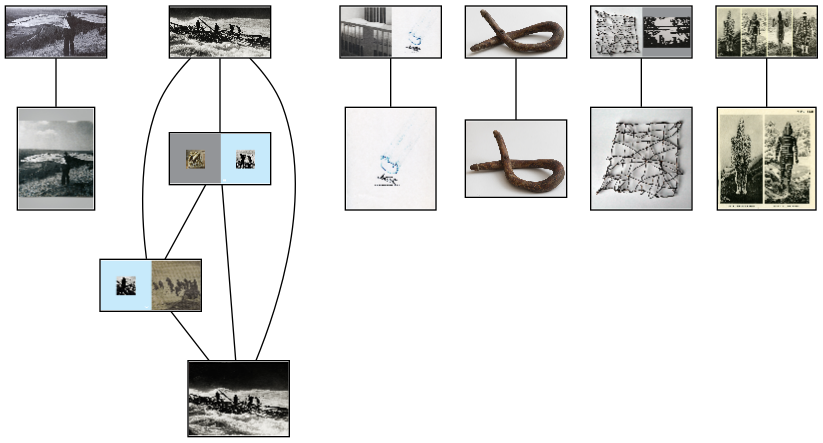
And an interactive version of this graph, using d3.js and a force layout: